Quick Links
- Leak 1: Ticket Pricing That Hasn’t Moved While Your Costs Have
- Leak 2: Dispatch and Drive Time on Emergency Calls
- Leak-3-truck-substitutions-that-cost-more-than-the-estimate
- Leak 4: Warranty and Callback Work Nobody’s Tracking Against the Original Job
- What to Do About It
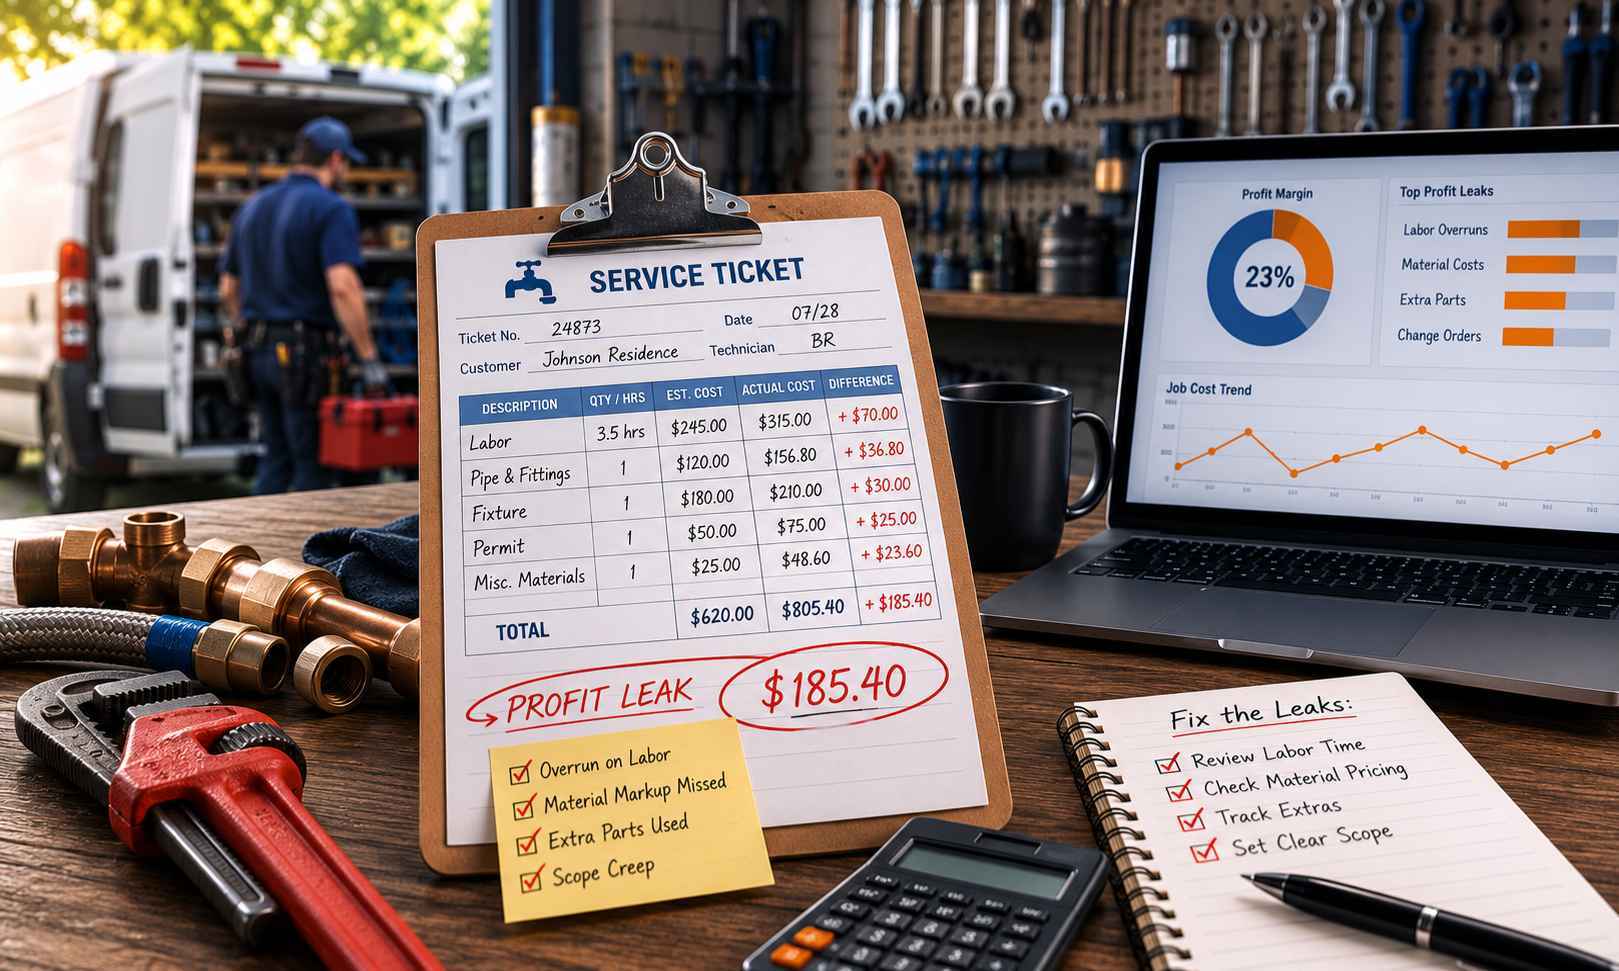
Picture a plumbing company that set its service ticket pricing two years ago. (Illustrative example, not a specific client.) The price for a water heater swap, a drain clearing call, a toilet replacement- all of it got set once, based on what materials and labor cost at the time. Nobody’s touched it since.
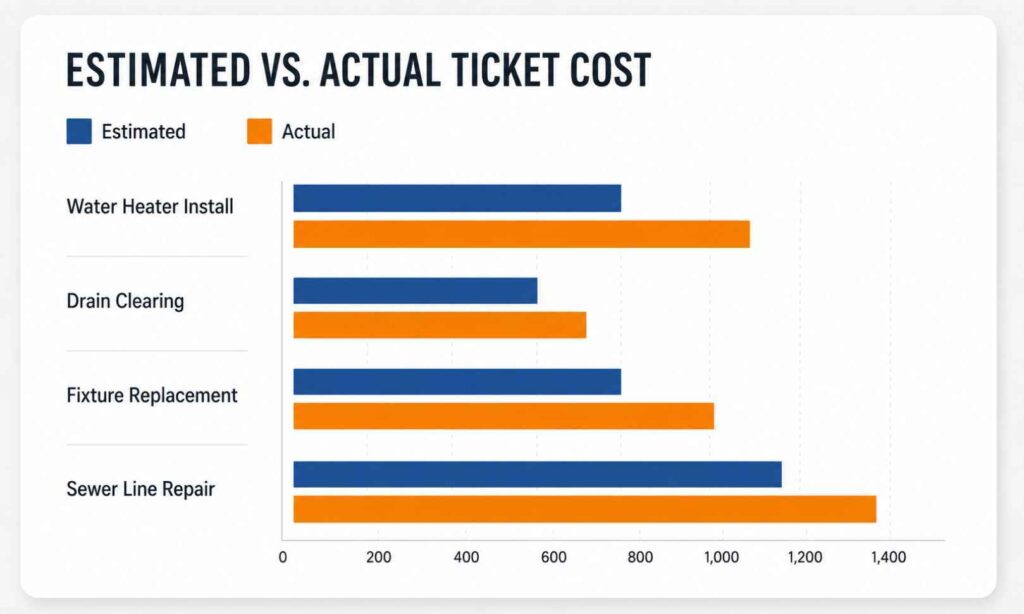
In the two years since, PEX fittings cost more. Water heaters cost more. The tech wage went up, because it had to, because good plumbers don’t stay for flat pay while everything else moves. The ticket price never moved.
This isn’t a story about one bad month. It’s the default state of most service ticket pricing in plumbing businesses that are otherwise doing fine. Jobs get done. Trucks roll. Invoices go out. And the business slowly becomes less profitable each quarter, without a single dramatic event to point to.
Job costing is the only way to see it. Revenue and invoice count tell you the volume. Only tracking what each ticket actually costs against what it was priced to cost tells you whether the volume is worth doing.
Here are four specific places plumbing businesses lose margin without noticing, and how budget vs actual tracking, by ticket type, catches each one.
Leak 1: Ticket Pricing That Hasn’t Moved While Your Costs Have
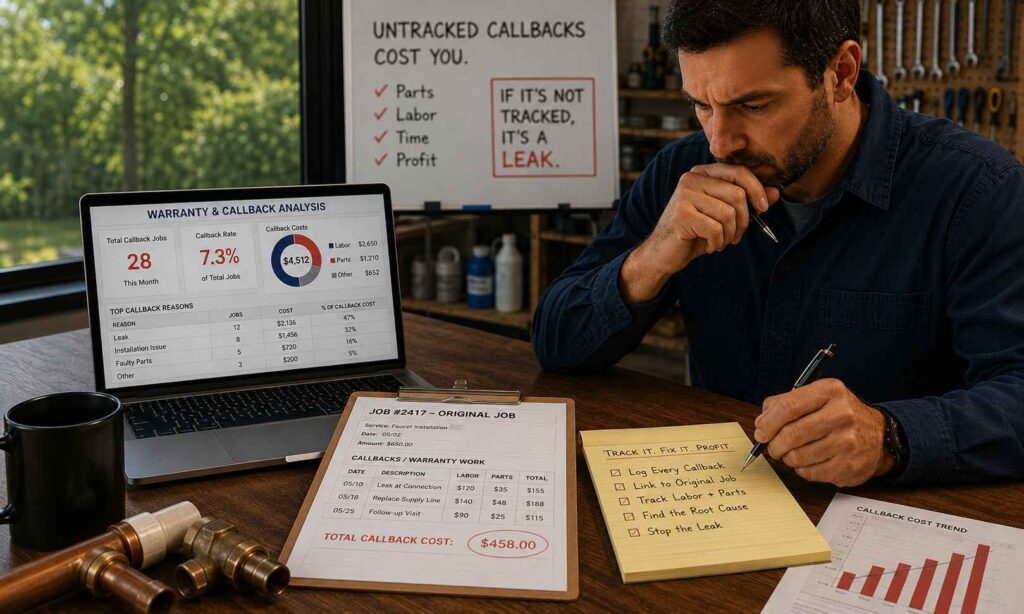
Most plumbing shops price by ticket type: drain clearing, water heater install, fixture replacement, sewer line repair. That pricing gets set once, usually when the owner is busy with other things, and then it sits. Materials costs and hourly labor rates don’t sit. They move every year, sometimes every quarter on volatile items like copper and PEX.
The gap between what a ticket costs today and what it was priced to cost two years ago doesn’t show up as one bad job. It shows up as a slow margin decline across every job of that type, month after month, that nobody catches because no single ticket looks alarming on its own.
How Budget vs Actual surfaces this: instead of looking at one water heater job and wondering if it ran a little high, you see all your water heater installs for the quarter lined up against the original estimate. If 40 jobs are running consistently over estimate on materials, that’s not an outlier. That’s your pricing, and it needs a second look.
Leak 2: Dispatch and Drive Time on Emergency Calls
Emergency and after-hours calls carry a real cost that most ticket pricing doesn’t fully account for: drive time, fuel, dispatch coordination, and often a tech pulled off a scheduled job to go handle it. Many shops price emergency calls close to standard service pricing, with a flat “emergency fee” bolted on that was set once and never revisited against actual dispatch cost.
The problem compounds because emergency calls are, by definition, less predictable. A tech driving 35 minutes across town for an after-hours call priced assuming a 15-minute drive is losing money on that ticket before he even opens his toolbox.
How Budget vs Actual surfaces this: instead of looking at one water heater job and wondering if it ran a little high, you see all your water heater installs for the quarter lined up against the original estimate. If 40 jobs are running consistently over estimate on materials, that’s not an outlier. That’s your pricing, and it needs a second look.
Leak 3: Truck Substitutions That Cost More Than the Estimate
A tech is on site, the job calls for a specific fitting or part, and what’s on the truck isn’t quite it. He substitutes something close enough to get the job done. Maybe it costs a little more per unit. Maybe it’s a different brand with a different markup. Either way, the original estimate assumed one material cost, and the actual job used another.
One substitution on one job is nothing. The same substitution pattern happening across dozens of service calls a month, because your trucks are consistently stocked with a slightly more expensive alternative to what your estimates assume, is a real and recurring cost that never gets flagged, because no one is comparing estimated materials cost to actual materials cost at the ticket level.
How Budget vs Actual surfaces this: when actual materials cost is tracked against the original estimate for every ticket, substitution patterns become visible fast. You’re not hunting for it. It shows up as a consistent gap between estimated and actual materials cost on a specific job type, and that gap has a cause you can go find.
Leak 4: Warranty and Callback Work Nobody’s Tracking Against the Original Job
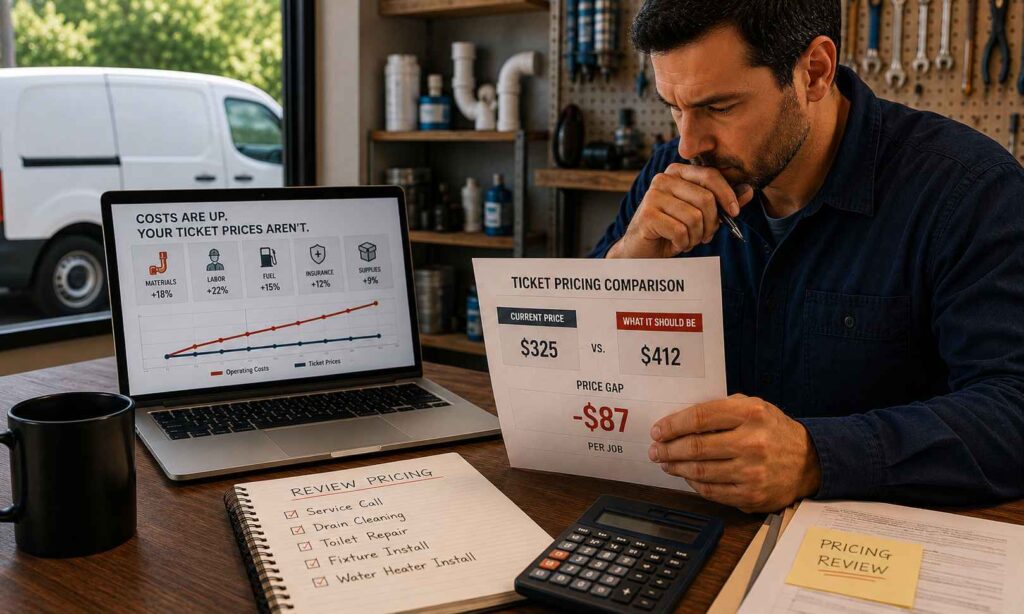
A customer calls back. Something wasn’t quite right, or a part failed early, or the original fix didn’t hold. The tech goes back out, no charge, because that’s the right call for the relationship. That return visit has a real labor and materials cost. It’s rarely tracked against the original job’s profitability. It just becomes an unbilled hour that disappears into overhead.
Over a year, callback work on a specific job type or from a specific tech can quietly erase the margin that job type was supposed to generate in the first place. Without tracking it against the original ticket, you have no way of knowing whether your callback rate on water heater installs, say, is normal or whether it’s eating the job type’s entire profit.
How Budget vs Actual surfaces this: when a callback is logged against the original job rather than treated as a separate, untracked event, the original ticket’s true cost, including the return visit, becomes visible. If callback frequency on a job type is high enough to be worth investigating, whether it’s a training issue, a parts quality issue, or an estimating issue, you’ll see it in the pattern instead of guessing.
What to Do About It
Two changes fix most of this, and neither requires new habits you’re not already capable of.
Review ticket pricing against current material and labor costs at least twice a year. Materials costs and wage rates don’t wait for you to notice they’ve moved. A pricing review every six months, checked against your actual current costs rather than what you remember costs being, keeps your ticket pricing from quietly falling behind. If you want a neutral starting point for current national labor benchmarks by task, PHCC’s Labor Unit Database is a reasonable gut-check before you touch your own numbers.
Track actual cost against estimate by ticket type, not just by month. A monthly P&L tells you whether the business made money last month. It doesn’t tell you whether your water heater installations are profitable, and your drain clearing calls are losing money, or the other way around. Job-level tracking, by ticket type, is the only way to see which specific work is worth doing and which is quietly subsidised by the rest.
Most plumbing businesses aren’t losing money because the work is bad or the team is slow. They’re losing it in small, consistent gaps between what a ticket was priced to cost and what it actually costs, spread across enough jobs that nobody notices any one of them.
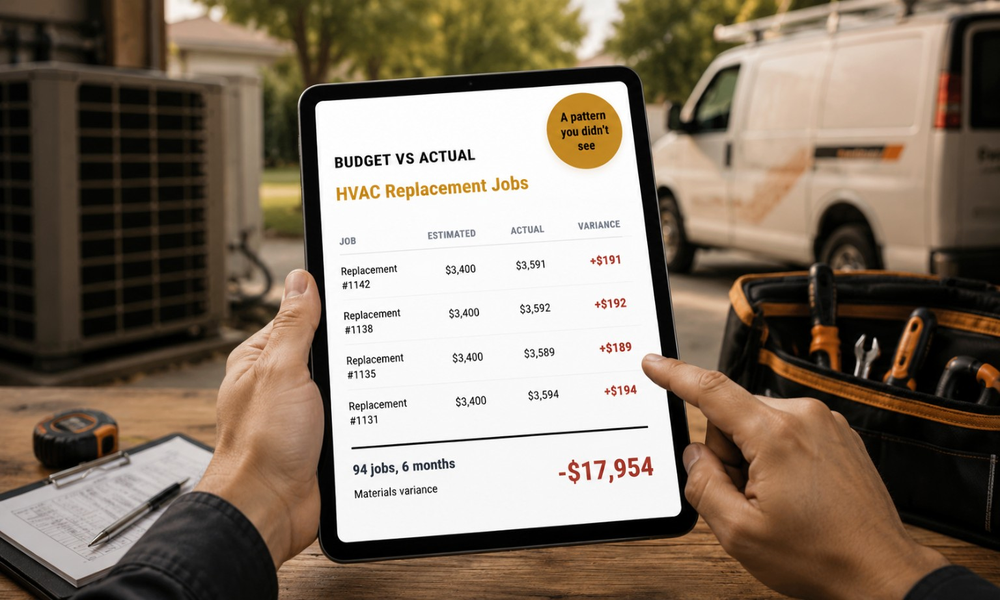
This isn’t a plumbing-specific problem. We found the same pattern showing up in HVAC businesses that are busy but not profitable, and in route-based landscaping crews that stay fully booked and still lose money. Different trade, same blind spot.
If you want to see what that gap looks like in your own ticket data, see how Budget vs Actual works. It’s built around plumbing job types, service tickets, install and replacement jobs, and takes less than an hour to walk through.